The RMP has made millions of measurements of water quality in the Bay. These data reside in a publicly accessible database called the Contaminant Data Display and Download (CD3) tool (cd3.sfei.org). We have learned a lot from these data, but there is more to be learned. For two years, the RMP has sponsored this data exploration challenge to encourage students to explore the data and gain new insights. Check out last year’s winning submissions here.
Scenario:
Many people from an array of different ethnic communities consume fish from San Francisco Bay, including low-income groups that depend on Bay fish as an inexpensive source of nutrition. However, not all fish from the Bay can be safely consumed regularly, due to mercury and PCBs, two contaminants that are present above thresholds for concern. To protect the health of Bay Area anglers and their families, we want you to help us identify the safest places to go fishing, with the lowest exposure to mercury and PCBs.
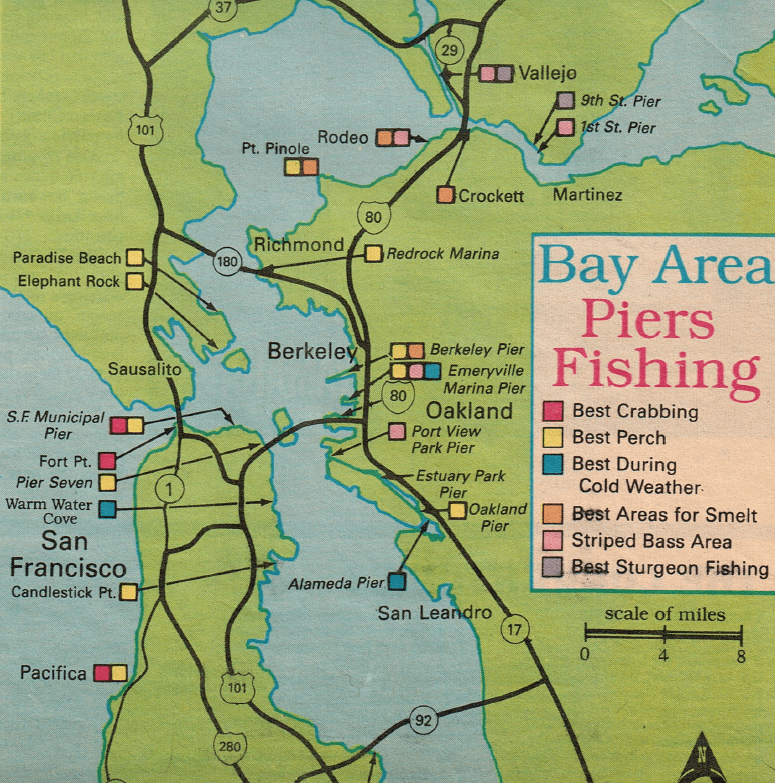
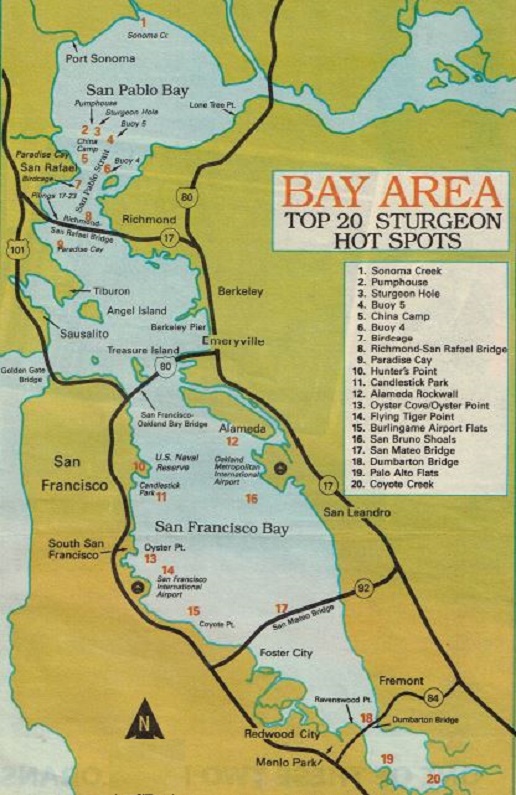
Using provided maps of common fishing areas and data available in the Contaminant Data Display and Download (CD3) tool (cd3.sfei.org), explore areas where fishing and contaminant data overlap. Investigate mercury and PCB contamination in and around these areas by looking at concentrations in sediment and/or tissue.
Answer the following questions:
#1 Is there a relationship between contaminant concentration in sediment and fish tissue from samples collected in the same area?
- Where is contamination the most acute?
- Is there evidence that fish and nearby sediment contamination are linked?
- If there is not consistently a relationship between sediment and fish tissue, what could be causing that difference?
#2 Is there evidence of improvement over time in sediment and/or fish tissue?
Useful resources:
- Bay Area Fishing Locations:
- Catch reports
- Printed fishing maps: (larger versions of images attached as PDF files below)

- CD3 Tool video tutorials & FAQ page: https://cd3.sfei.org/faq.php
- Office of Environmental Health Hazard Assessment (OEHHA) fish advisories: https://oehha.ca.gov/fish/advisories
- The Pulse of the Bay reports: www.sfei.org/programs/pulse-bay
Sign me up! What do I need to do?
- Dive into the data at cd3.sfei.org
- For help navigating CD3 visit the FAQ Page
- Now including video tutorials! (e.g., Lesson 2A: Mapping results, Lesson 2C: Filtering by Area)
- Analyze patterns and relationships in the data
- Create a one-page static or interactive graphic (e.g., single or set of images, web page, animated graph, video) that answers each question and includes explanatory captions
- Write an abstract/summary that describes the methods used and important findings for each question
- This can be an interpretative summary that is up to one-page (400 words) and describes the problem statement, methods used, findings, and the implications of the findings.
Email submissions to [email protected]
Contest Details:
Prizes: |
Eligibility: |
Evaluation Criteria(Submittals will be scored based on these criteria) |
| 1st Place — $500 2nd Place — $250 |
|
|
SUBMISSIONS DUE 11/27/2020, WITH WINNERS ANNOUNCED IN DECEMBER 2020