The Santa Clara Valley Water District (Valley Water) is a California Special District water resources agency in Santa Clara County providing safe, clean water for a healthy life, environment and economy, flood protection, and stewardship of streams on behalf of the county’s residents. Over the last two decades the Santa Clara County voters approved the Safe, Clean Water and Natural Flood Protection Program that identified a number of local priorities. The ecology focused Priority D implements projects that aim to restore and protect wildlife habitat. Project D5 focuses on ecological data collection and analysis to track stream ecosystem health.
A recent 2025 Upper Pajaro River Watershed stream condition survey, was completed by Valley Water’s Project D5 with science and field monitoring support from the San Francisco Estuary Institute (SFEI) and SWCA employing the California Rapid Assessment Method (CRAM). The goal of the survey was to reassess the overall ecological condition of streams across the watershed and begin to track potential ecological changes since the first baseline condition survey completed in 2015.
The data analysis tables provided below are the statistical analysis results for the Upper Pajaro River Watershed stream condition survey summarized in the Final Report. The surveys employ a spatially balanced random sample design developed by the EPA (using a generalized random-tessellation stratified (GRTS) algorithm to select spatially balanced samples). The field collected assessment data are analyzed using the SPSURVEY Design and Analysis Package in R to produce an estimate of the overall ecological condition of streams across the watershed and within its primary areas of interest (PAIs).
The following datasets are available for download:
1_ContinuousCDF_Estimates_2015&2025
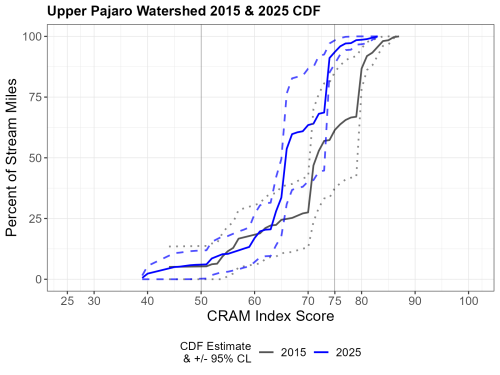
Cumulative distribution function estimates of the overall condition of streams in the Upper Pajaro Watershed and its PAIs. These are the files used to create the CDF curve plots in the final report.
2_Categorical_Estimates_based_onCRAMConditionClass__2015&2025
Estimates of the overall percent of streams resources in the Upper Pajaro Watershed and its PAIs that are in Poor, Fair, or Good ecological condition based on CRAM’s equal-interval condition classes. The condition classes are defined as tertiles of the maximum range of possible CRAM Index or Attribute Scores, with Poor condition scores ranging from 25 to 50, Fair condition scores from 51 to 75, and Good condition scores from 76 to 100. These are the files used to create the bar charts in the report.
3_Change_Analysis_Estimates_catsum_contsum
The results of this statistical analysis compares results between the two survey periods (2015 and 2025), based on (1) the continuous mean CDF outputs and (2) the categorical (Poor, Fair, Good condition) results. These results were used to identify which specific aspects of stream condition (as measured by CRAM at the Index and Attribute Score levels) were significantly different between surveys.