HOW IT ALL STARTED
In 1997, a scientist at San Francisco Estuary Institute (SFEI) apprehensively boarded a plane for Washington D.C. and the National Archives. His assignment was to look through a dusty set of maps that might help him understand the San Francisco Estuary’s (Estuary) historical wetlands. What he found exceeded his expectations: a set of maps made almost 150 years before that depicted the channels, tidal marsh, and tidal flats that defined the historical wetlands at the edge of the Estuary in exquisite detail.
The maps examined in the archives—made by a largely forgotten agency called the U.S. Coast Survey—immediately fired his imagination. Until then, he had only seen faded black and white photocopies of pieces of the maps from a colleague at the California State Lands Commission. Called T-sheets, these maps detailed the tidal wetlands of the Estuary before Euro-American colonists and settlers diked, drained, and developed most of them. Re-discovering the T-sheets provided the key to more accurately understanding the Estuary’s lost tidal wetlands.
EARLY MAPPING AND WETLAND LOSS
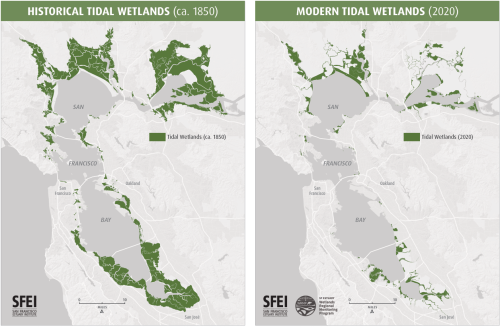
Map (A) depicts tidal wetland extent in the 1800s. This historical map was created by drawing from a number of historical sources, but the primary source for the intricate network of tidal channels and intertidal flats that detailed the tidal marsh were the T-sheets.
Ancillary maps and narratives were used to corroborate the historical wetland extent and refine features. Archival sources included the narratives of Spanish and English explorers, sketches from Mexican landowners supporting their land grant claims (California was part of Mexico), and other U.S. government, state, and county records from the 1850s. Sources included maps and documents from the U.S. Geological Survey (topographic maps), U.S. Department of Agriculture (soil surveys), early county maps and records, and geomorphic maps developed by California’s first State Geologist. The ca. 1850 baylands map has since been refined, and the map can be further improved with additional archival data and expanded Tribal input.
SIGNS OF RESTORATION SUCCESS
In the latter portion of the 20th century, the federal government and the state of California passed laws to protect wetland habitat and water quality. While this regulatory action slowed wetland loss, recent funding for restoration has accelerated the pace of recovery. The maps from 1998, 2009, and 2020 (B, C, and D) show the beginning of the recovery of the Estuary’s tidal wetlands after nearly a century of destruction. These newer maps also reflect the rapid increase in available scientific information and advanced technologies capable of capturing the state of our baylands.
ADVANCES IN MAPPING TECHNIQUES
The 1998 map (B) was created by incorporating earlier mapping efforts—the National Wetlands Inventory data as a baseline starting point, along with State Lands Commission tidal marsh polygons. NASA Aerial Photography was used to verify or update the wetlands. The process required manual visual data interpretation and hand-digitizing the boundaries of the wetlands. The team also incorporated the earliest wetland habitat projects from the EcoAtlas (www.ecoatlas.org) database. As a final step, regional experts reviewed the results.
The map from 2009 (C) included new information from the Bay Area Aquatic Resources Inventory (BAARI; www.sfei.org/baari), representing the most complete data layer on regionwide baylands habitat types and aquatic features at the time.
Finally, the Baylands Habitat Map 2020 (D) reflects the many changes in tidal wetland distribution and abundance that occurred over the previous two decades and includes additional information about land use and infrastructure. The 2020 mapping team used cutting-edge automated mapping approaches to support standardized and repeatable map creation, including a detailed habitat type key with clear definitions to guide the classification process. This work lays the foundation for consistent long-term mapping and change detection across the baylands for years to come. §