Visualizing Data to Support Decision-Making
Project: Sycamore Alluvial Woodland Restoration and Enhancement Suitability Study
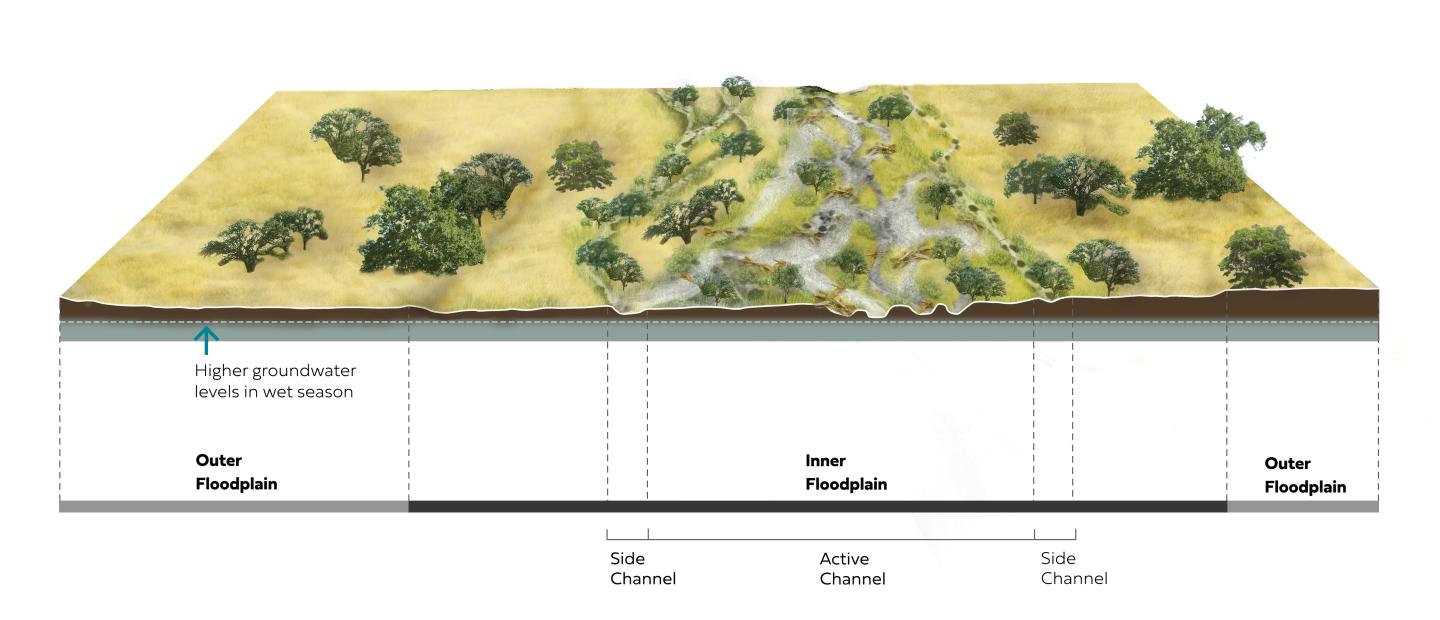
Sycamore alluvial woodland is a unique and relatively rare native vegetation community in California that is closely linked to dynamic stream processes. SFEI collaborated with H. T. Harvey & Associates to create a suitability study to guide restoration and enhancement efforts of this unique habitat. This 3D drawing of a conceptual historical channel illustrates the common features of stream segments that supported actively regenerating sycamore alluvial woodland habitat.
Focus Area:
Visualizing Data to Support Decision-Making
Visualizing Data to Support Decision-Making
Project: Adapting to Rising Tides: Bay Shoreline Flood Explorer
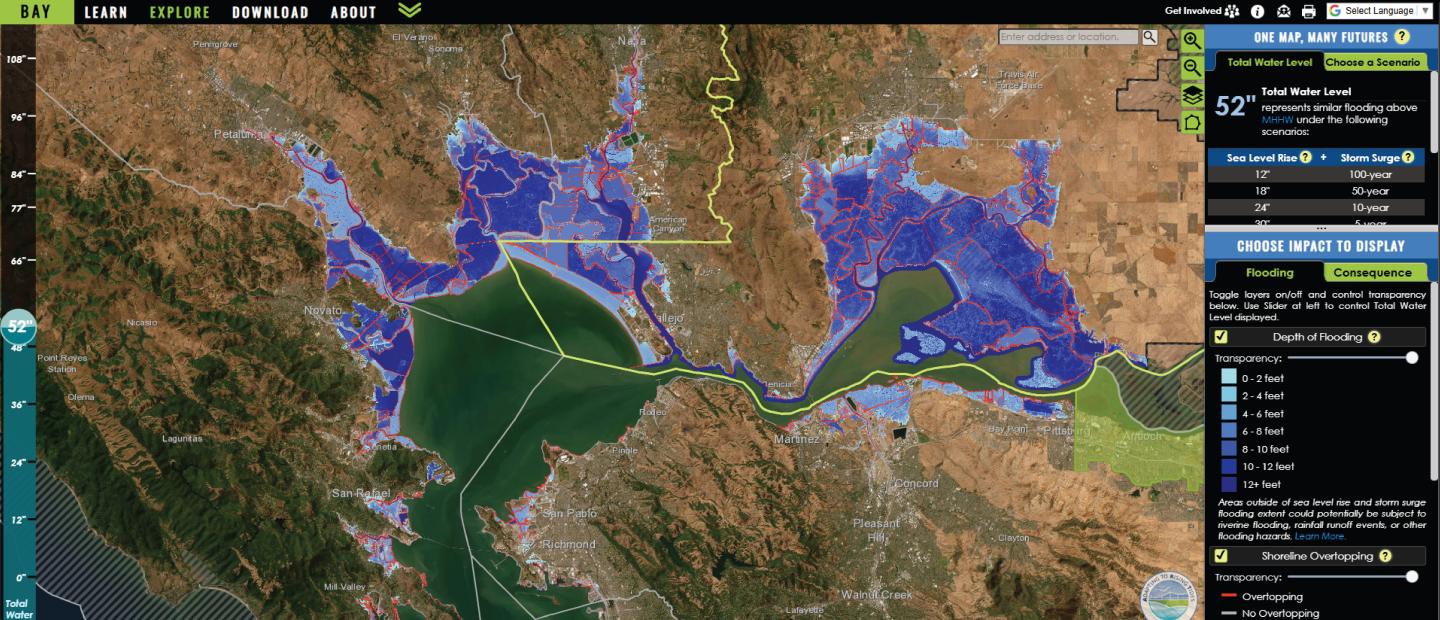
In partnership with the Bay Conservation and Development Commission, SFEI built the Bay Shoreline Flood Explorer, a tool that allows you to visualize sea level rise and flood risk projections. Design plays an important role in the tool, from establishing a strong brand to conveying technical data using colors and symbologies that are easy to understand. These elements help improve the user experience and amplify the tool’s impact: by easily visualizing the consequences of flooding, planners and decision makers can more effectively identify and prioritize adaptation responses.
Focus Area:
Visualizing Data to Support Decision-Making
Visualizing Data to Support Decision-Making
Project: Using Remote Sensing to Detect Harmful Algal Blooms
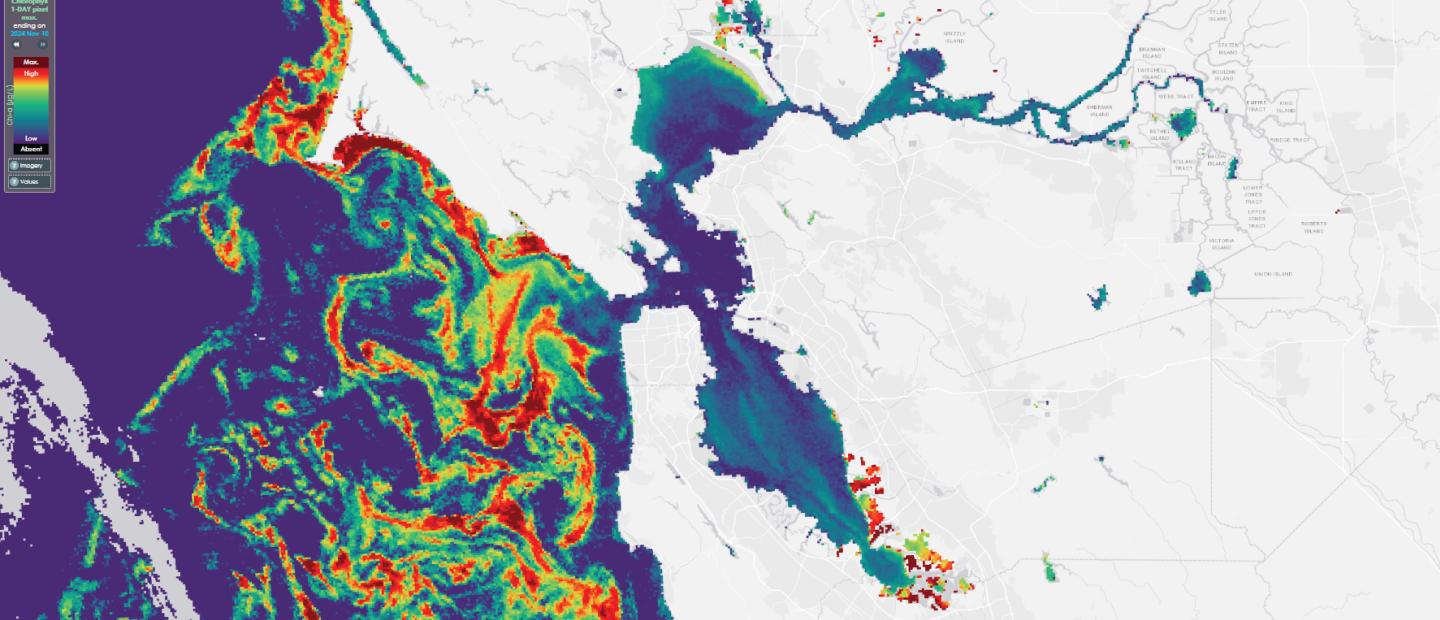
Cyanobacterial blooms pose serious threats to public health and fish and animal mortality. SFEI has developed a web-based tool to assist the State of California in monitoring harmful algal blooms. The tool utilizes satellite imagery to visualize bloom information and helps to characterize the seasonality, spatial distribution, and development of the blooms.
Focus Area:
Visualizing Data to Support Decision-Making
Visualizing Data to Support Decision-Making
Project: Making Nature’s City Toolkit
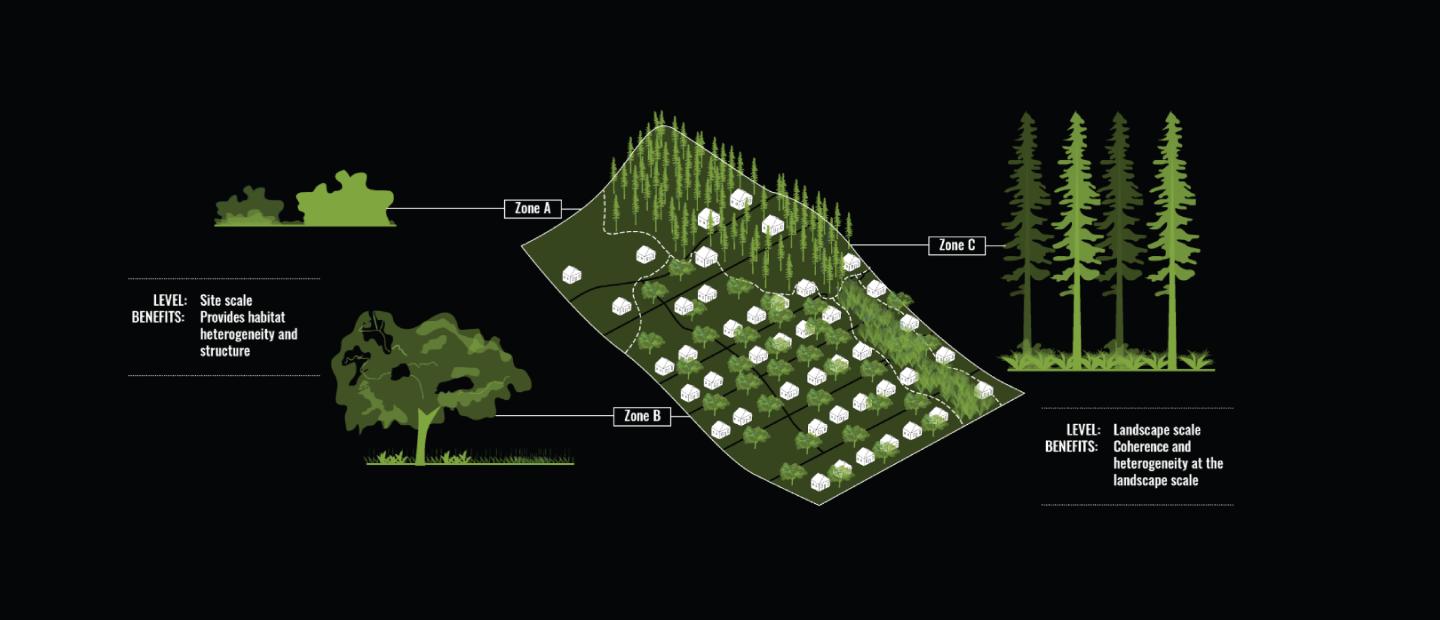
Thriving ecosystems are vital to human health and resilience in cities. We showcase findings from SFEI’s Making Nature’s City and Ecology for Health reports into a user-friendly website that provides accessible science, tools, and data to decision-makers in cities across the world. The website combines video, interactive graphics, photography, diagrams, and downloadable datasets into guidance for supporting urban nature in cities.The website allows users to easily access information and toggle between different scales in order to customize to their given project.