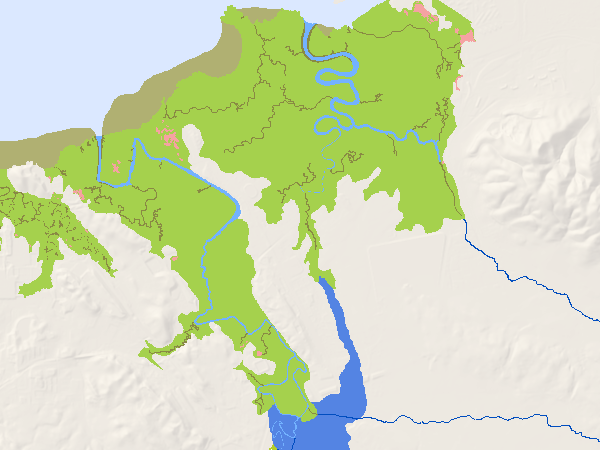
These five training modules cover the Wetland and Riparian Area Monitoring Plan (WRAMP) monitoring framework, from mapping where wetlands exist, to measuring their condition, to summarizing findings through reports and dashboards. The EcoAtlas tools are used by practitioners involved in wetland restoration planning, permitting, and monitoring.
MODULE 1: INTRODUCTION TO WRAMP LEVEL 1-2-3 FRAMEWORK AND TOOLS
What is the California wetland monitoring and assessment framework?
Module 1 provides an overview of the Wetland and Riparian Area Monitoring Plan (WRAMP), an adaptive management framework for collecting and analyzing environmental data and information to support stream and wetland project planning, monitoring, and assessment at a site, watershed, or landscape scale. WRAMP utilizes USEPA’s concept of a Level 1-2-3 approach to monitoring, which is how EcoAtlas organizes its data layers and online tools.

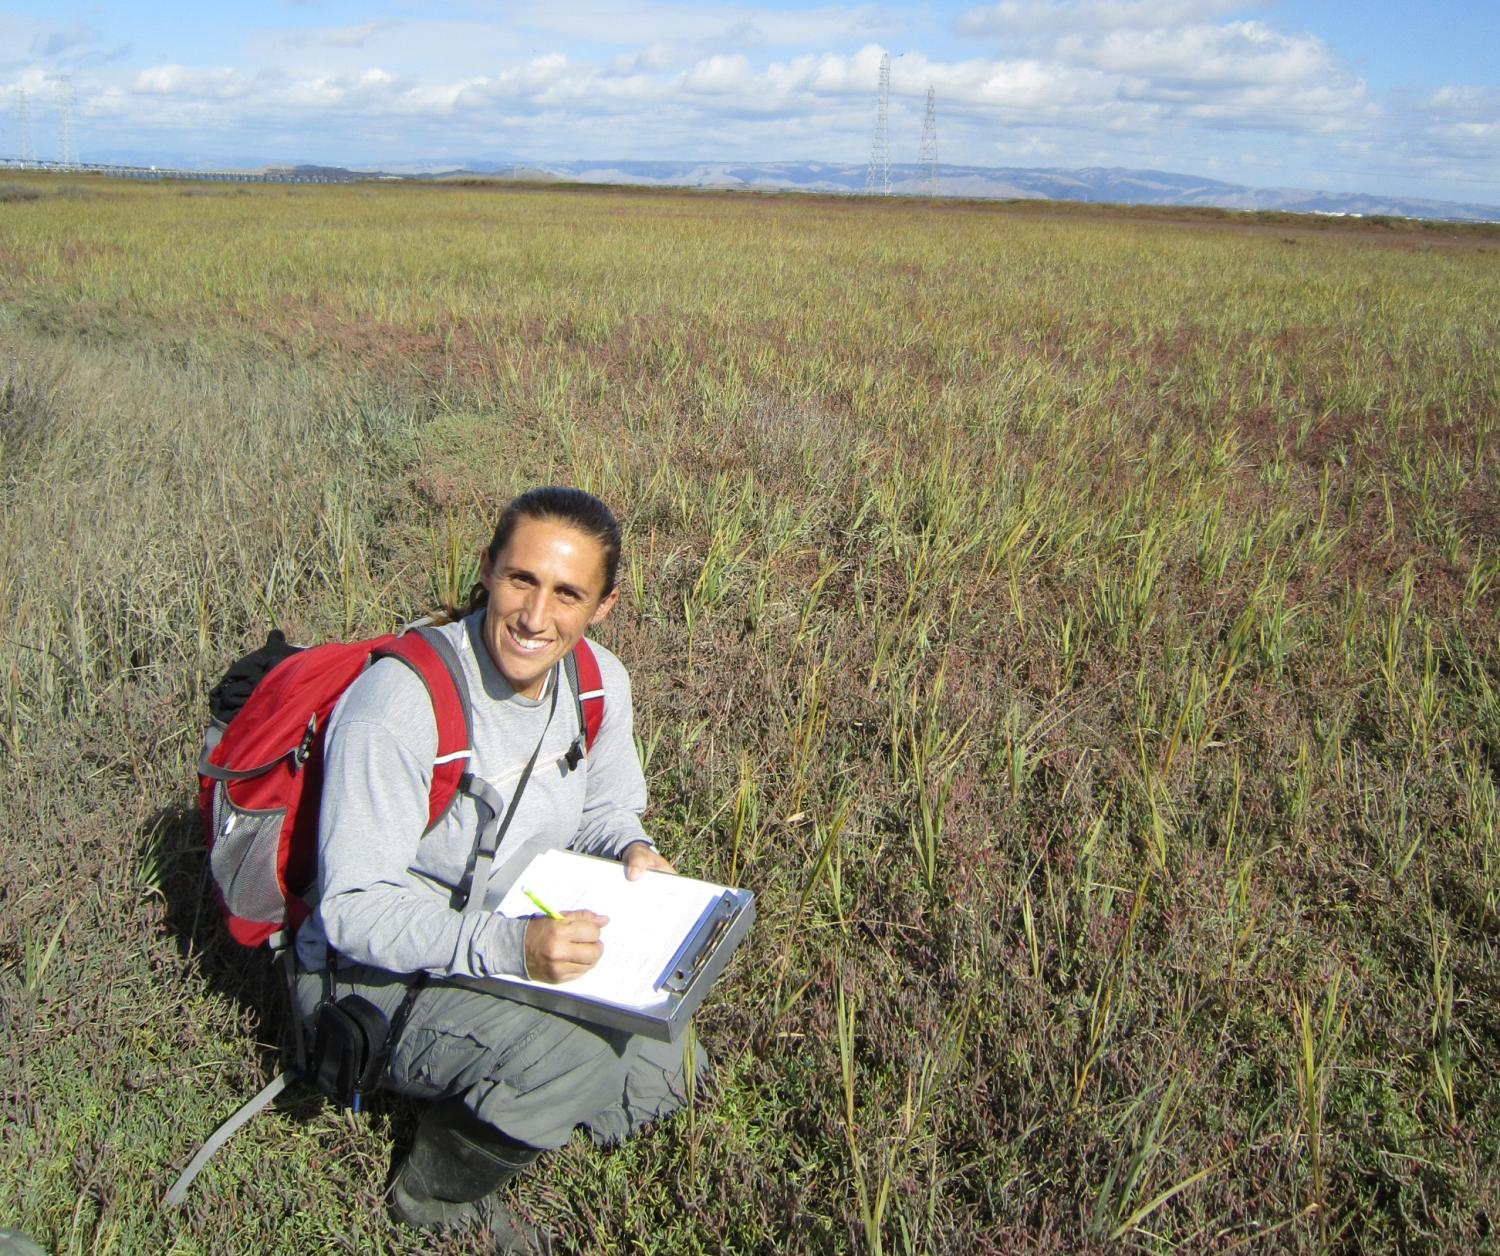
MODULE 2: LEVEL 1 MAP-BASED INVENTORY
Where are our wetlands and wetland projects?
Module 2 introduces landscape inventory information (Level 1) and tools available to answer geospatial questions. Topics include: how regional aquatic resource inventories are integrated into California Aquatic Resource Inventory (CARI) and how to edit the map using the CARI Editor Tool; how to enter/edit projects and map impacts and associated mitigation using Project Tracker; and how to access a project’s Habitat Development Curve (HDC) and use the Landscape Profile Tool (LPT) to generate summaries for an area of interest in EcoAtlas.
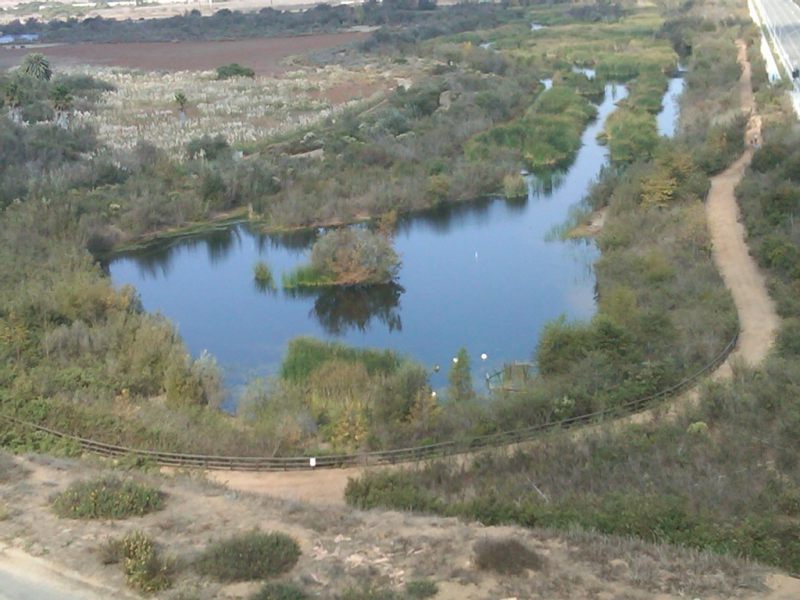
MODULE 3: LEVEL 2 CONDITION ASSESSMENTS
How are our wetlands doing?
Module 3 introduces the rapid assessment (Level 2) tools, relatively simple and cost-effective monitoring methods used to assess the condition of stream, wetland, and riparian habitats. The tools and topics include: California Rapid Assessment Method (CRAM) and Riparian Rapid Assessment Method (RipRAM) – an overview of the methodologies, training requirements, and how to interpret, access, and visualize CRAM scores in EcoAtlas.
MODULE 4: LEVEL 3 INTENSIVE SITE ASSESSMENTS
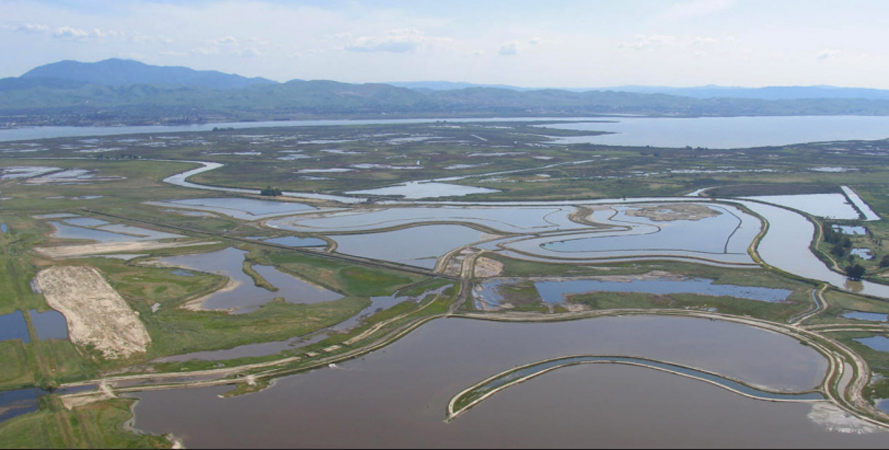
How can I find detailed information about a wetland site?
Module 4 explains how to find detailed wetland site information that goes beyond rapid assessments. Topics include: how to visualize and download field measurements on EcoAtlas from the California Environmental Data Exchange Network (CEDEN) and the California Stream Condition Index (CSCI). Additionally, users can plot and download water quality data using the Contaminant Data Display and Download (CD3) tool.
MODULE 5: DATA APPLICATIONS AND DASHBOARDS
How can I summarize wetland location and condition using a landscape approach?
Module 5 demonstrates how to view data and generate summary reports in EcoAtlas. Topics include: viewing individual data layers; using the Landscape Profile Tool to generate a Watershed Profile for an area of interest; viewing CRAM scores within their landscape context on ambient Cumulative Distribution Function (CDF) plots; evaluating a restoration project’s performance through time on its Habitat Development Curve (HDC); and visualizing progress towards regional or programmatic restoration targets using the EcoAtlas Dashboards.