EcoAtlas’ performance evaluation tools help managers review and track project performance especially when restoration and mitigation projects (1) share project planning and implementation status information in Project Tracker, and (2) use CRAM as a standardized monitoring method to track project performance. At a regional or restoration program scale, EcoAtlas dashboards summarize the amount of wetlands lost and gained, the kinds (and total acres) of wetland projects that are planned, in progress, or have been completed, and the amount of funding spent on wetland restoration. This section presents Project Tracker and CRAM-based project evaluation tools available in EcoAtlas and its dashboards.
Project Status Tracking
How can my project information and status be shared?
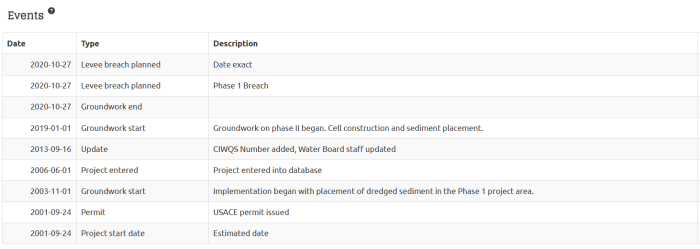
You can use Project Tracker to share project information throughout the entire project lifecycle—from early planning and permitting, through implementation, and into long-term performance monitoring. Entering details such as project location, wetland habitat extents, planned and completed activities (e.g., permit information, ground-disturbance start and end dates), expenditures, and associated documents helps ensure that resource agencies and the public have access to accurate, up-to-date information.
Project Tracker also feeds directly into EcoAtlas dashboards and summary tools, allowing project statistics and outcomes to be aggregated and visualized alongside other efforts statewide. Each project’s information page serves as a public-facing portal where users can view project status updates, monitoring reports, photos, and other relevant documents.
To maintain transparency and support accurate statewide reporting, project information should be updated regularly throughout the project’s lifecycle. Keeping the record current improves understanding of the project’s progress, effectiveness, and overall influence.
Click here for a video showing how to enter and update information in Project Tracker.
Enter and update information in Project Tracker
Aquatic Resource Modifications
How is my project changing the amount and distribution of aquatic resources in the area?
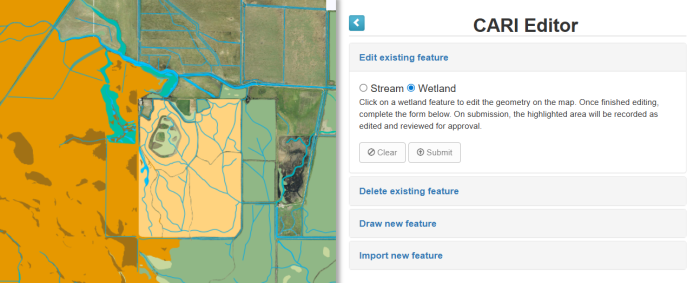
Project actions such as the creation of new wetlands, expansion of wetlands, alteration of stream course or wetland location, change in wetland type, or the filling/removal of wetlands can be recorded and tracked through updates in the California Aquatic Resources Inventory (CARI) mapping. Using the CARI editor, project proponents can update the Level 1 map of aquatic resources based upon the actions occurring within their project to indicate how the project is contributing to or modifying the amount and distribution of wetlands. Providing map-based updates enables resource managers to quantify and track how wetland restoration and mitigation projects collectively change the amount and distribution of wetlands at local and regional scales.
Update the aquatic resources mapping using the CARI editor
No-Net-Loss in Wetland Area
How is my project contributing to the No-Net-Loss policy?
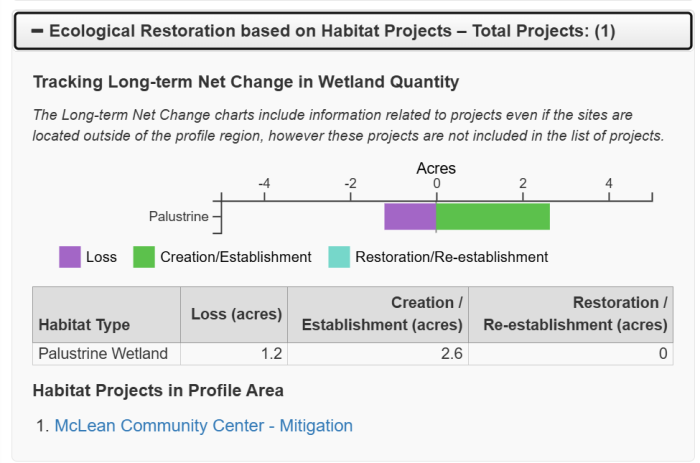
After entering project information into Project Tracker (such as actions, habitats, and the amount of wetland areas impacted, mitigated and/or restored), the Landscape Profile tool can be used at a pre-defined or user-defined scale to quantify the amounts and types of wetlands either lost or gained due to both wetland impacts and mitigation/restoration actions. Viewing the “Ecological Restoration based on Habitat Projects” tab within the resulting Landscape Profile produces a summary bar graph that shows the types of wetland habitats and associated acres of loss, creation/establishment, and restoration/re-establishment for the area of interest. The profile summarizes contributions from all projects within the selected area of interest, and includes individual project details and links.
Learn more about tracking long-term net change in wetland quantity
Programmatic Tracking
What are the effects of individual programs and organizations?
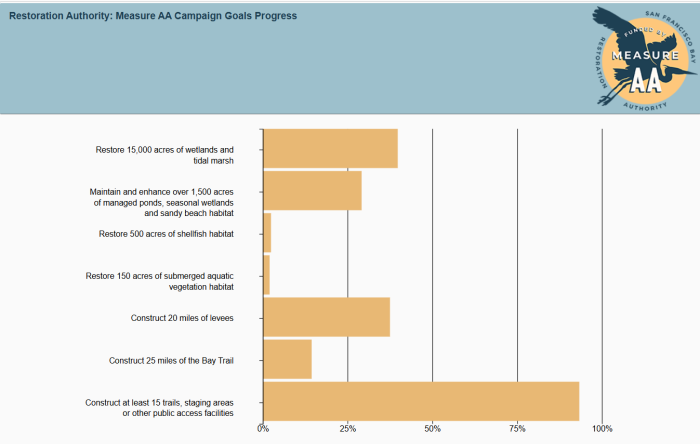
EcoAtlas summarizes information about the project actions of wetland restoration, mitigation, conservation, and acquisition projects in a series of interactive summary charts within programmatic dashboards. The dashboards use information within Project Tracker and the California Aquatic Resources Inventory (CARI) to dynamically calculate the cumulative outcomes of public policies and programs that protect and manage California’s aquatic resources. Programs such as the San Francisco Bay Restoration Authority, the Southern California Wetlands Recovery Project, the Ocean Protection Council, the San Francisco Estuary Wetlands Regional Monitoring Program, and the Santa Clara Valley Water District have all utilized EcoAtlas tools to track progress towards their programmatic goals. Individual dashboards (1) track the amount of money spent by program, region, county, and activity type, (2) track activities by region, activity type, and habitat type (3) track the number of and acres of projects by region, HUC 12, congressional district, and construction status, (4) track progress towards priority-specific milestones for individual programs, and (5) track improvement in wetland conditions for program specific areas.
Explore dashboard visualizations in EcoAtlas
Quantifying Condition
What is the ecological condition of wetlands in my project area, and how can it guide future management?
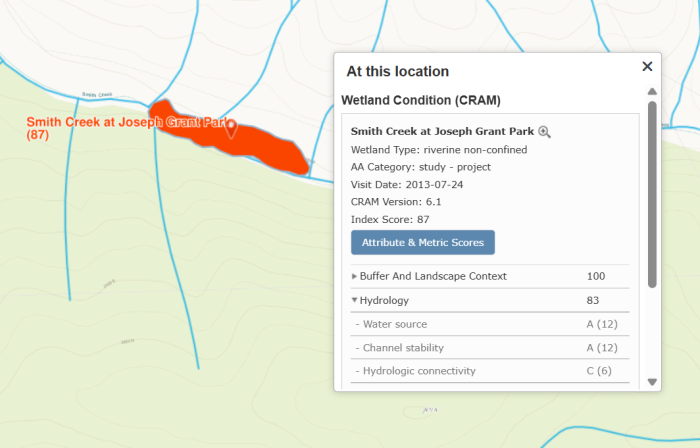
The California Rapid Assessment Method (CRAM) can be employed to evaluate the overall ecological condition of streams or wetlands within projects. CRAM is a standardized, cost-effective monitoring method that can evaluate and track changes in wetland condition beginning with pre-project baseline conditions and continuing through project completion, the required monitoring period, and for years following. The results of an assessment can be used to identify whether specific aspects of stream or wetland form or function are underperforming by “drilling down” into the Attribute and Metric Scores, giving managers standardized, science-based measures to compare conditions within and between projects and to guide adaptive management actions.Individual Metric Scores can also be viewed and/or downloaded for evaluation if CRAM Metric Scores were included as a success measure or as performance criteria within a restoration or mitigation monitoring plan.
View and utilize CRAM scores within a project area
Riparian Condition
What is the condition of riparian areas in my project?
In addition to CRAM, RipRAM (Riparian Rapid Assessment Method) can be used to evaluate the condition of riparian ecosystems. RipRAM is specifically designed to assess the ecological condition of riparian corridors within the extent of the FEMA 100-year floodplain, with a focus on riparian vegetation cover, structure, and quality, along with impacts to the riparian width, soil condition, and regeneration. It can be used in conjunction with CRAM to evaluate an area of interest, providing information about the wider, less-frequently inundated floodplains area around riverine habitats.
Learn more about the information RipRAM can provide
Comparing Project and Regional Conditions
How does my project’s performance compare at the watershed or regional scale?
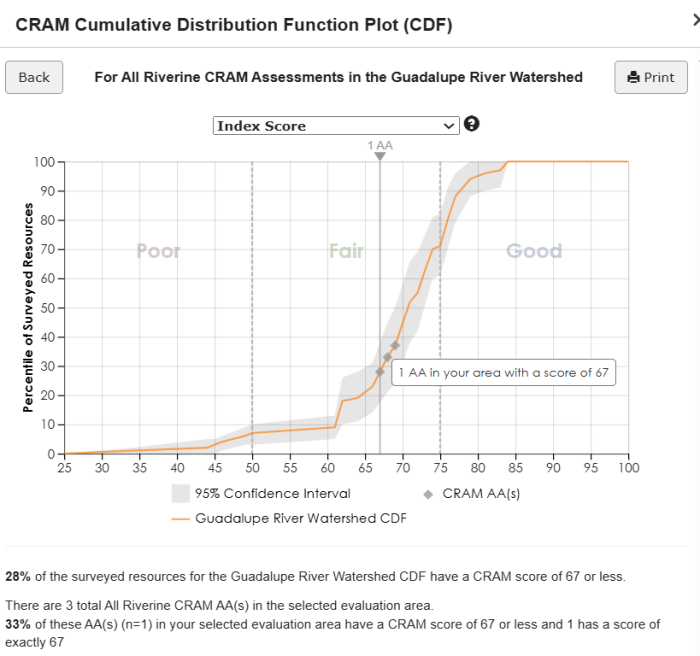
Changes in project conditions through time can be tracked and visualized using a cumulative distribution function (CDF) curve. A CDF (developed from a statistically random survey) estimates the relative conditions of wetlands using CRAM across a watershed, ecoregion, or statewide, allowing the proportion of wetlands in that area with any given score to be estimated. The Condition Profile mode of the Landscape Profile tool allows users to access CDFs for different wetland types and different areas of interest. By selecting the project footprint as your area of interest, any CRAM assessment(s) that have been conducted on the project wetland(s) will be plotted on the CDF, allowing the user to compare how project scores fit among the range of wetland conditions across the watershed or other pre-defined landscape scales.
In addition, you can plot the CRAM assessment scores on the CDF for a single assessment area that has been assessed at multiple points in time. This allows you to compare the relative amount of ecological lift at the site against the range of conditions across the watershed or other landscape areas. This action is completed by again using the Condition Profile mode of the Landscape Profile tool, but instead of selecting the entire project footprint as your area of interest, instead selecting a tiny area of interest that only includes the footprint of the individual assessment area.
Plot project CRAM assessments on a CDF
Tracking Project Performance
Are the wetlands in my project developing as expected?
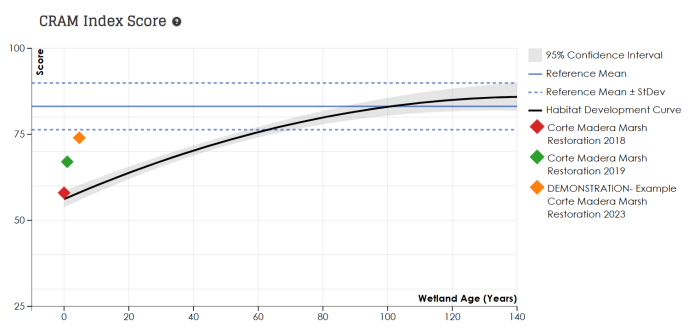
Changes in project conditions through time can be tracked and visualized using a habitat development curve (HDC), which plots the expected rate of wetland maturation (or improvement in condition as measured by CRAM) through time for restoration/mitigation projects by wetland type. The HDC tool is accessed through individual Habitat Projects (either viewed as a layer in EcoAtlas, or accessed via the Habitat Projects Tool in EcoAtlas), where existing CRAM assessments, located within the project footprint, are plotted on a habitat development curve for that wetland type. The plot will include all CRAM scores that have been submitted, and plot them based upon the number of years since project completion, allowing you to compare the change in condition through time. Project assessments that plot on or above the curve indicate that the wetland is likely to continue to improve in condition towards reference condition. Assessments that plot below the curve indicate wetlands where some adaptive management actions are warranted. This tool allows project proponents and regulators the ability to evaluate the likely future condition of a project wetland at any point in time, such as 5 or 10 years after project completion (time frames typical of permit-required monitoring). The HDC also allows you to estimate when a project wetland is likely to reach reference condition, which is often much longer than 5 or 10 years, allowing for a greater understanding of expectations for any given project stream or wetland.
Access an HDC for an individual habitat project
No-Net-Loss in Condition
How is my project contributing to no-net-loss in wetland condition?
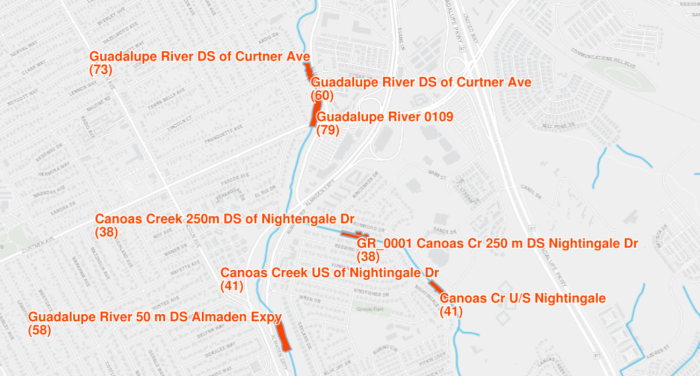
Project actions should maintain or improve wetland condition over time. CRAM provides a standardized approach for tracking condition trajectories, allowing you to quantify a project’s contribution to no-net-loss in condition and to identify any potential declines. Users can select, view, and download CRAM scores for individual assessments or groups of assessments, enabling straightforward comparisons across years. In addition, scores from nearby wetlands—including potential reference sites—can be downloaded to help identify broader regional influences on condition, such as prolonged drought, extreme storm events, wildfire-related sediment pulses, shifts in salinity or freshwater inflow, sea-level rise, or other climate-driven changes that may be affecting wetlands across the region.
Download CRAM scores
Tracking Progress Towards Goals
How have specific project actions contributed towards achieving stated goals?
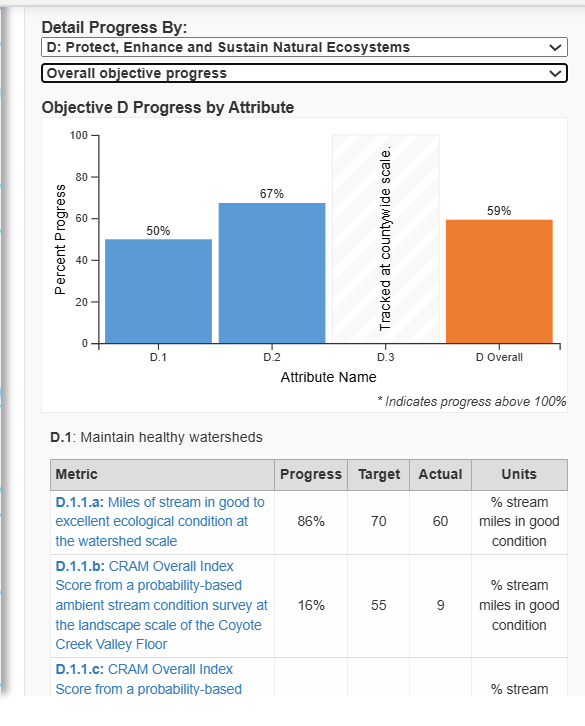
EcoAtlas can also be used to track progress toward specific, detailed program objectives. For example, the Santa Clara Valley Water District (Valley Water) uses a custom “Watershed Master Plan Profile” dashboard to report progress on its habitat-related metrics. This dashboard displays maps, reports, baseline conditions for aquatic and terrestrial habitats, differences between baseline and target conditions, water-supply and flood-risk information, and other key indicators—providing both organizational accountability and clear public communication.
Even if your project is not within a region that uses EcoAtlas for program-level tracking, the platform can still help articulate the value of your work. Landscape Profile information allows you to show (1) how the amount of aquatic resources in your project area compares to the watershed or to historical aquatic resource amounts, (2) how your project increased wetland extent, (3) how it improved aquatic resource condition, and (4) how it enhanced habitat connectivity. Project outcomes can also be compared to Dashboard data to illustrate contributions to regional metrics such as acreage restored by activity or habitat type, or funding invested by region.
In addition, regulatory staff evaluating a project without a Project Tracker entry or CRAM data can still use EcoAtlas for context. Monitoring reports, CRAM scores, and other information from nearby or comparable projects can help inform their assessment.
View Valley Water’s Watershed Master Plan Profile