
EcoAtlas was developed to provide accessible, synthesized information on the quantity and quality of California’s streams and wetlands. It includes geospatial data on the extent and distribution of aquatic resources, locations of habitat projects, and additional layers such as hydric soils, vegetation, land use, and land ownership. EcoAtlas also houses field-collected data on wetland condition, water quality, macroinvertebrates, and other ecological indicators. Nearly all datasets within EcoAtlas can be downloaded for further exploration, analysis, and use. The following section describes how users can access and download these data, and how EcoAtlas analysis tools can be used to examine the information in greater depth.
Download Geospatial Data
What geospatial data layers are available for download?
The work of protecting and managing streams and wetlands begins with map-based, or Level 1 data that answers the question “Where are the aquatic resources and habitat restoration projects?”. Having access to maps that show the aquatic resources (both current and historical), the habitat projects, riparian extents, and other basic information such as land cover is essential for resource managers and planners. A number of map-based data layers are available for download through EcoAtlas, including: (1) California Aquatic Resources Inventory (CARI) and Region-specific Aquatic Resource Inventories, (2) Historical Aquatic Resources and Terrestrial Plant Communities, (3) Eelgrass Aquatic Resources, (4) Riparian Management, (5) Habitat Projects from Project Tracker, and (6) the National Land Cover Dataset. Visiting the Data page provides information about each dataset and the link to download the data.
Download spatial data layers displayed in EcoAtlas

Download Condition Data
What wetland condition data are available for download?
Understanding the distribution, abundance, and extent of aquatic resources is only half of the equation; the second half is understanding the ecological condition of those resources. EcoAtlas tools allow you to interactively evaluate what areas are in good, fair, and poor condition, compare individual aquatic resources, “drill down” into the condition scores to investigate specifics about the condition of a location, plan projects based on their landscape context, track change over time, and quantitatively measure project performance through time. Condition data, including California Rapid Assessment Method (CRAM) assessments and California Stream Condition Index (CSCI) data can be downloaded in a number of formats including GIS shapefiles, KMZs, and tabular CSVs, allowing for more complex manipulations and analyses.
Download ecological condition data within EcoAtlas

Download Other Detailed Data
What other relevant data are available for download?
In addition to the overall ecological condition of aquatic resources, sometimes more detailed, or Level 3 data is needed to gain a complete understanding of an area for project planning or post-project monitoring. A number of detailed datasets are available for download, including (1) site-specific water, sediment, and toxicity data linked from the California Environmental Data Exchange Network (CEDEN) database, (2) the California Natural Diversity Database (CNDDB), (3) the Soil Survey Geographic Database (SSURGO) Hydric Soils layer, and (4) the US Census data. These data can be combined with other project-specific information to explore questions about where aquatic resources might be located, which might be restored, and what potential benefits projects might provide for issues such as water quality, species support, or community benefits.
Download detailed data within EcoAtlas

Landscape Profiles
- Overview of Landscape Profile Tools
-
How do I summarize EcoAtlas information for an area of interest?
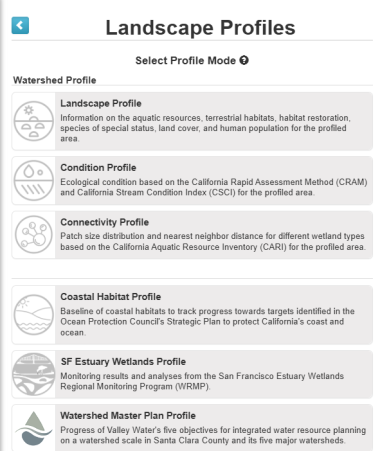
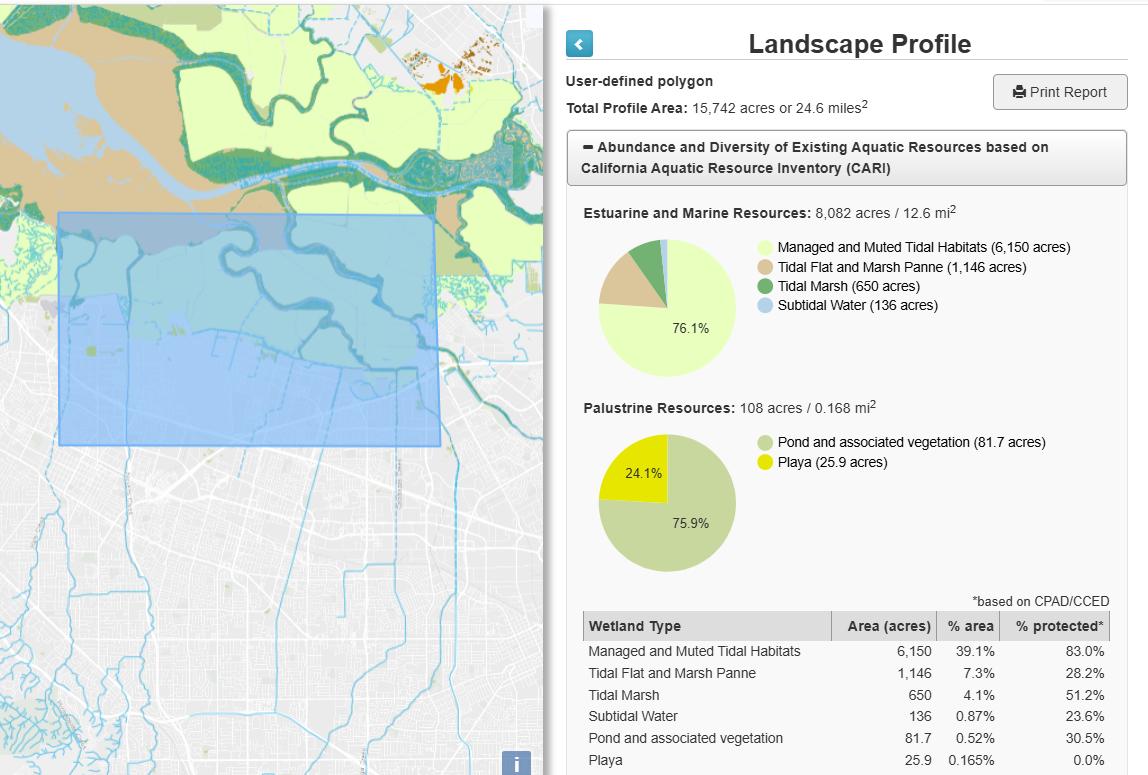
The Landscape Profile Tool allows the user to create a Watershed Profile that summarizes the amounts, distribution, and conditions of aquatic resources in any user-defined area by wetland type. You can draw your own area of interest, select from a number of predefined areas (e.g. watershed or county), upload your own kml or shapefile, or auto-delineate a basin using USGS’ Stream Stats. Where historical data exist, the Landscape Profile Tool includes information on mapped historical aquatic resources. The Condition Profile Tool summarizes CRAM and CSCI data, and a summary of recommended watershed prioritization actions that support the protection of streams and associated riparian habitats in the user-defined area. The Connectivity Profile Tool displays wetland patch size distributions and nearest neighbor distances by wetland type. Profiles can be viewed online or downloaded as a PDF document with the date it was downloaded. These tools support data-driven planning by helping identify all mapped aquatic resources, including rare wetland types. Such information can guide decisions on whether resources should be protected, enhanced, or potentially re-created to address historic losses, ensuring that wetland restoration and mitigation projects are grounded in a comprehensive watershed perspective.
Use the Landscape Profile Tool to summarize aquatic resources
- Landscape Profile
-
How do I summarize aquatic resource information?
The Landscape Profile Tool summarizes the amount and distribution of aquatic resources mapped in CARI for any user-defined area, by wetland type. User-defined areas can be a project footprint, a pre-defined watershed, or other boundary. Where historical data exist, the Landscape Profile Tool will also summarize the amount and distribution of mapped historical aquatic resources.
- Condition Profile
-
How do I summarize wetland condition information?
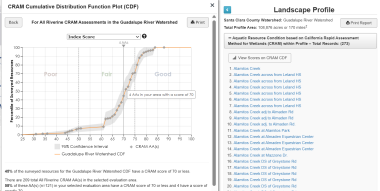
One of the primary tools for analyzing California Rapid Assessment Method (CRAM) condition data is a cumulative distribution function (CDF) curve. For an area of interest (e.g. a watershed or an ecoregion), a CDF shows the estimated proportions of streams or wetlands that have a specific CRAM score (or lower) with a known level of confidence. The CDF also simplifies CRAM scores by showing them in three health classes: Good, Fair, and Poor. Plotting CRAM scores on a CDF allows questions to be answered such as:
- In what health class (Good, Fair, or Poor) are my wetlands of interest?
- How do my wetlands of interest compare to the condition of wetlands in the watershed or across the ecoregion?
- In what percentile of condition are the wetlands of interest? Do they represent a low percentile of condition and should be targeted for restoration, or are they in a high percentile and should be targeted for protection?
- Which wetlands are contributing towards improving condition within the watershed?
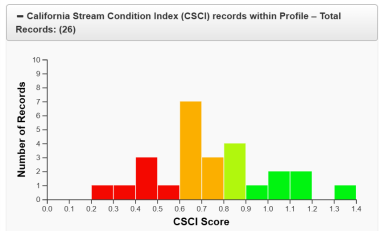
In addition, the Condition Profile also provides information based upon the California Stream Condition Index (CSCI) if data exists within your area of interest, as well as output regarding watershed prioritization recommended actions through the Riparian Management data layer.
How to create a Condition Profile report and how to access and review a project’s CRAM condition scores on a cumulative distribution function (CDF) curve from an ambient survey
- Connectivity Profile
-
How do I summarize wetland habitat connectivity?
Evaluating wetland habitat connectivity involves intensive geospatial calculations to characterize the distribution of wetland patch sizes and nearest neighbor distances. These analyses have been completed at the HUC12 scale based on CARI. You can explore the landscape connectivity among wetlands in your greater project area using the “Connectivity Profile” within the Landscape Profile Tool. This Profile can help you evaluate and consider the potential impacts (either positive or negative) that your project might have on the distribution of habitat patch sizes or the distances among habitat patches in the region.
How to use the Connectivity Profile

Track Project Performance
How do I track change in wetland condition for a project?
In addition to cumulative distribution function (CDF) curves, another primary tool for analyzing CRAM condition data is a habitat development curve (HDC). An HDC plots the expected rate of maturation, or improvement in condition, through time for project wetlands by wetland type. The HDC tool compares the number of years since project completion versus the CRAM score, plotting individual project assessments on the curve. HDCs are accessed through individual Habitat Projects, where existing CRAM assessments within the project footprint are automatically plotted based upon the number of years since project completion, allowing you to see the change in condition through time. This tool allows project proponents and regulators the ability to evaluate the likely future condition of a project wetland at any point in time. This tool also allows for estimation of when a project wetland is likely to reach reference condition, allowing for a greater understanding of expectations for any given project stream or wetland.
Access an HDC for an individual habitat project

Customized Profiles
How do I summarize management goals and targets for specific programs?
State and local programs have funded the development of program-specific Landscape Profile Tools including the Ocean Protection Council, the San Francisco Estuary Wetlands Monitoring Program (WRMP), and the Santa Clara Valley Water District (Valley Water).
The Coastal Habitat Profile summarizes the total acres of coastal wetlands in California and the proportions of those wetlands that are being protected, restored or created over the coming decades. The WRMP’s Profile summarizes the amount of tidal wetlands by wetland type, the restoration status of tidal wetland projects, the ratio of vegetated versus unvegetated areas, and their relative elevations compared to Mean High Water by a number of WRMP pre-defined areas across the San Francisco Bay Area. Valley Water is employing a number of EcoAtlas tools including CRAM for developing watershed wide cumulative distribution function estimates (CDFs) of condition for five of the major watersheds in Santa Clara County, public access to (1) view, summarize, and download their monitoring program’s CRAM data, and (2) to a summary profile of their progress towards meeting a number of their voter-approved One Water Watershed Master Plan performance metric targets for each of the five major watersheds.
Access the custom Landscape Profiles in EcoAtlas

Regional and Programmatic Dashboards
How do I summarize high-level information for a region or by program?
The Dashboards within EcoAtlas summarize programmatic information about restoration, mitigation, conservation, and acquisition projects, including the cumulative benefits of public policies and programs that protect and manage California’s aquatic resources. Individual dashboards can track (1) the amount of money spent by program, by region, by county, and by activity type, (2) track activities and habitat by region, by activity type,and by habitat type (3) track projects by region, by HUC 12, by congressional district, and by status, (4) track progress towards goals for individual programs, and (5) track improvement in wetland condition for individual program aquatic areas. Information displayed on the Dashboards allow you to summarize restoration/mitigation/enhancement/protection activities for your area of interest, and contextualize a specific project within the larger region or program’s efforts and goals.
Explore dashboard visualizations in EcoAtlas

