Microplastics and Harmful Algal Blooms in California's waters
Mar 20, 2017
For the new microplastics study, please read this article. See below for additional information about the harmful algal blooms viewer.
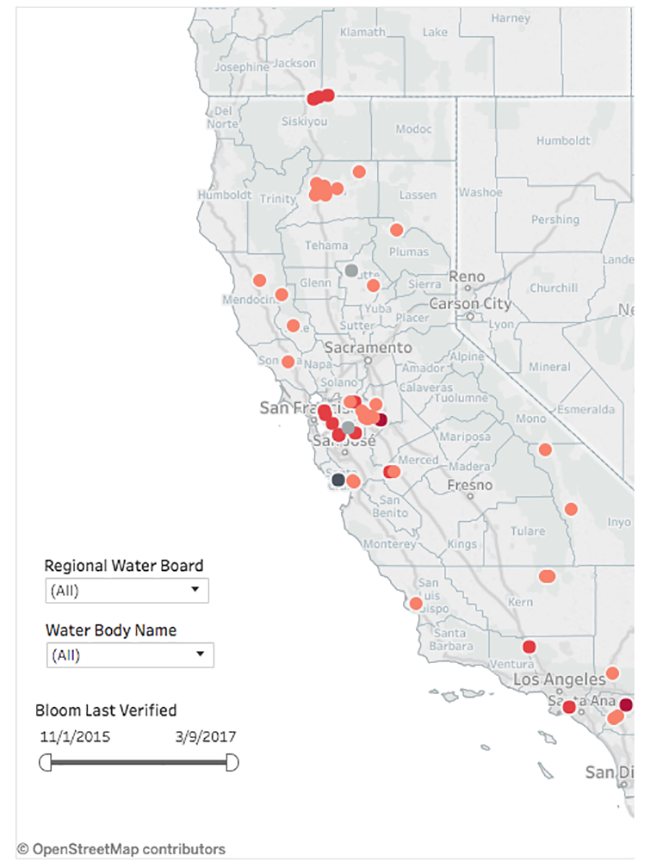
By May 1, 2017, in time for harmful algal bloom season, a new feature will appear on California's Harmful Algal Bloom portal (http://www.mywaterquality.ca.gov/habs/) that displays satellite imagery designed to detect emerging and historical blooms. Using data and algorithms provided by NOAA's National Centers for Coastal Ocean Science, the San Francisco Estuary Institute developed a new tool under the guidance of California's Bio-accumulation Oversight Group. The map interface uses satellite data to display estimated concentrations of cyanobacteria in large water bodies to better understand potential risks to public health. Data is displayed in map form to show the spatial extent of blooms and is also viewable in long and short timelines to show how concentrations vary over time. Additionally, field data can simultaneously be displayed from the California Environmental Data Exchange Network to provide users a combination of information sources to better understand the status and trends of cyanobacteria blooms and the potential risks to public health.
The new tool offers water body managers and the public the opportunity to review and compare remote imagery and discrete water sample sources of information in an exploratory interface. As the satellite imagery improves over time, the data quality will likely also increase, as will the tool's value for decision-making.
Associated Staff:
Programs and Focus Areas:
Clean Water Program
Nutrients
Related Projects, News, and Events:
 Building a framework for an integrated HAB detection and monitoring system (Project)
Over the last decade, harmful algal blooms (HABs) have emerged as one of the highest-priority water quality management issues in the San Francisco Estuary, which includes the San Francisco Bay (Bay) and Sacramento-San Joaquin River Delta (Delta). Although major HAB events in the Bay have historically been rare, recent studies have determined that multiple HAB species and their toxins are frequently detected in the Bay, highlighting the potential for major HAB risks.
 Statewide Plastics Monitoring Plan & Strategy (Project)
Plastics, in their various chemical composition and sizes, pose serious challenges to the vitality of California's ecosystems. Once escaped into the environment, plastic contamination persists for very long periods and breaks down into ever smaller pieces, becoming more readily available to wildlife and populations who live, work, and play in those same habitats.
 Vehicle Tires Threaten Water Quality (News)
Update: On October 1, 2023: California Department of Toxic Substance Control (DTSC) 6PPD regulations became effective, making it the first government in the world to regulate the chemical content of vehicle tires to protect salmon. DTSC is requiring tire manufacturers to identify alternatives to the tire preservative that is the source of the chemical toxic to coho salmon.